CLEM Applications
Selected examples of CLEM usage at ScopeM are listed below.
Immunolabeling as a tool to identify the ROI for high-resolution SEM
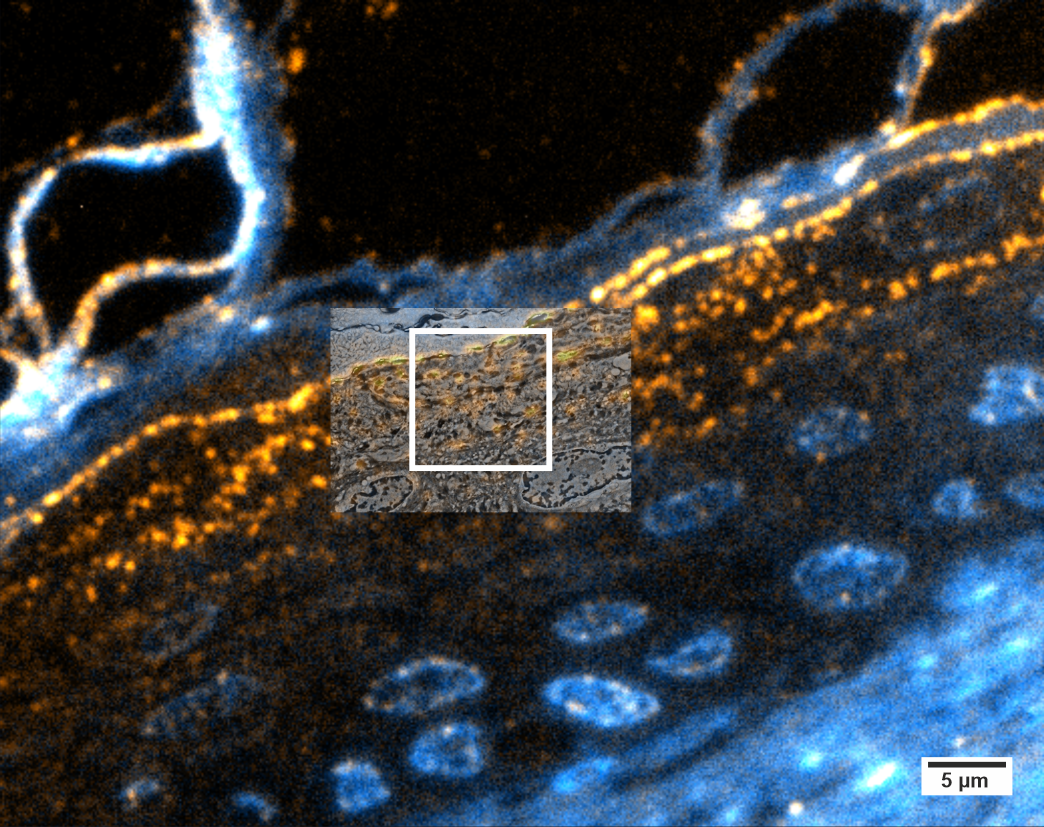
Here, a resin section of human skin was labeled for glucosylceramide (orange), a sphingolipid involved in mitogenesis and final epidermal differentiation. The skin sample was high-pressure frozen and freeze-substituted in the presence of uranyl acetate and finally embedded in HM20 acrylic resin. 100 nm thick sections were mounted on ITO- coated coverslips, a transparent, but conductive support well suited for correlative imaging in LM and SEM. Immunofluorescence shows the localization of glucosylceramide in lamellar bodies in the stratum granulosum and upper stratum spinosum, accounting for the typical bead chain- like pattern once exported into the intercellular space at the interface to the stratum corneum. Nuclei were stained with Dapi (blue).
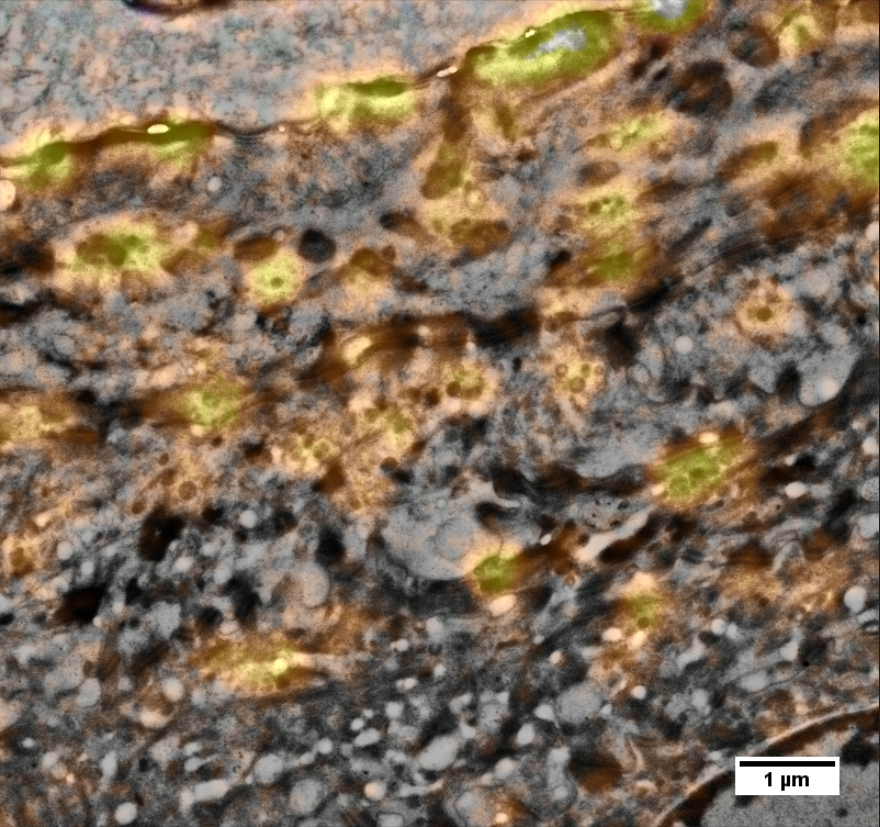
The ROI was relocated in the SEM using “Zeiss Shuttle & Find.” The enlargement (position marked by white frame in upper image) shows an overlay image of fluorescence signal and SEM. It demonstrates the difference in imaging resolution of the two microscopy modalities: while the fluorescence signal shows rather large ovoid shapes of approx. 500 nm in diameter, the SEM image reveals clusters of up to five vesicles or lamellar bodies no larger than 100–200 nm where only one fluorescence spot is detected. It even exposes vesicles that have no corresponding fluorescence spot at all.
Further reading: DOI 10.1016/b978-0-12-416026-2.00017-0
Correlative live cell imaging and FIB-SEM
Correlation of live-cell TIRF imaging with FIB-SEM using a U2OS-derived stable cell line co-expressing a mitochondrial and an endoplasmatic reticulum marker (courtesy of Prof. Dr. Benoît Kornmann; external page Kanfer et al., 2015)
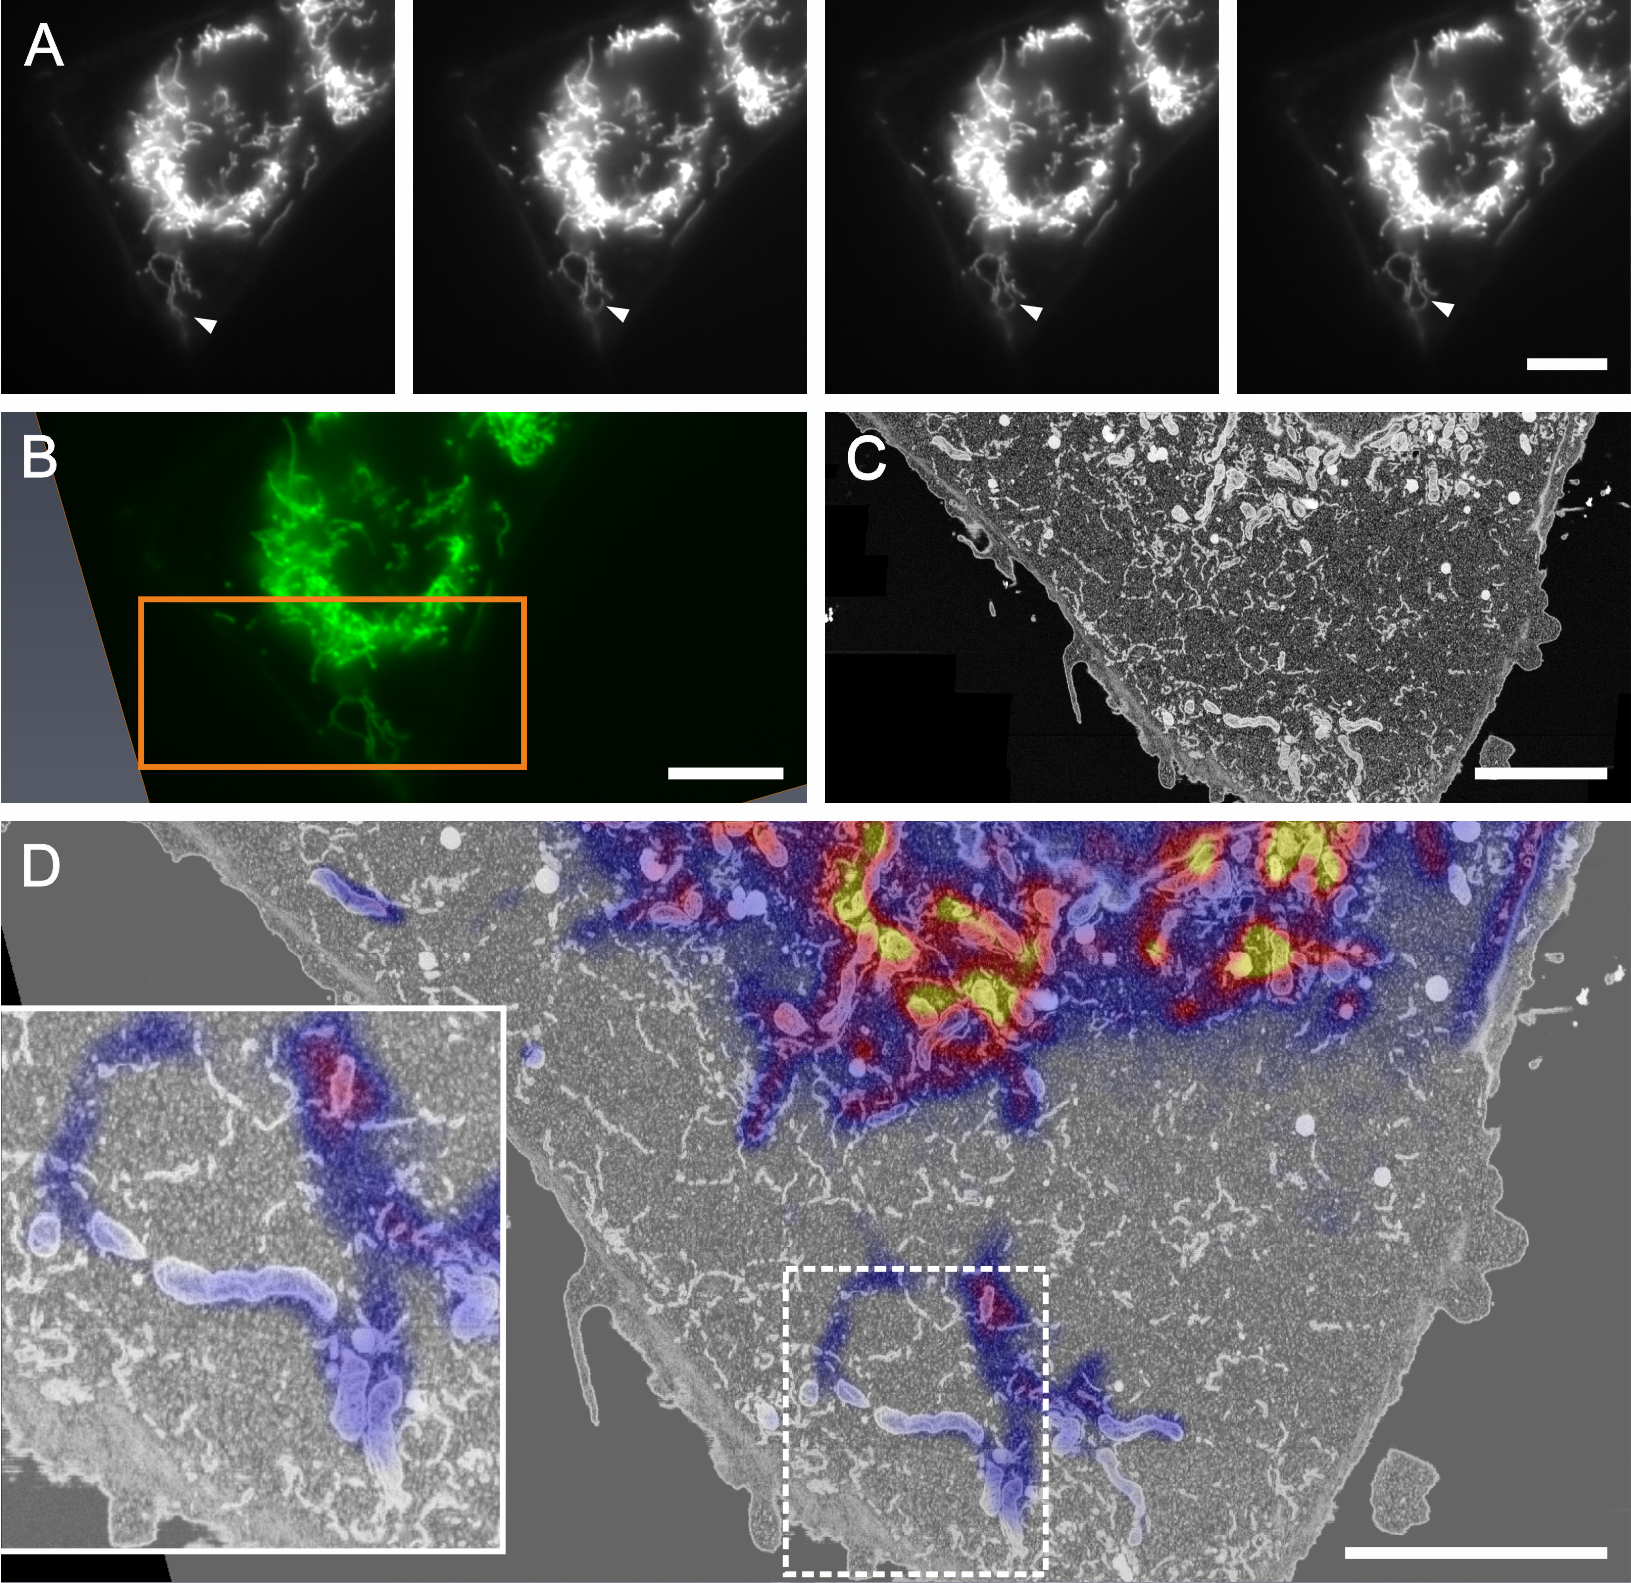
(A) A time-lapse series of TIRF images was acquired capturing the movement of mitochondria (arrowhead) over 100 s (at 0, 30, 60, and 100 s from left to right), then at the time of interest the sample was chemically fixed.
(B) TIFR image of the same ROI after chemical fixation. After preparation for EM (heavy metal contrasting, dehydration and resin embedding) the same ROI was relocated and a FIB-SEM volume of this cell was recorded (position marked by orange rectangle).
(C) Virtual slice of the FIB-SEM volume matching the primary imaging orientation of the TIRF images to facilitate the correlation.
(D) Overlay of images B and C: the LM overlay is depicted using a lookup table ranging from blue to yellow for better visibility. Here, the resolution mismatch of the two imaging techniques becomes apparent: The FIB-SEM dataset has a much finer depth-resolution (8 nm isotropic voxels) compared to the TIRF image, therefore fluorescence signal recorded in a single imaging plane in LM is generated from a larger volume (z-resolution 200 µm), explaining the fluorescence signal in areas where no mitochondria are depicted in a single virtual slice of the FIB-SEM stack (inset).
Further reading: DOI 10.1016/bs.mcb.2017.03.001